Author: LBank Research Analyst: Ludo
Disclaimer: This report is compiled and analyzed from publicly available information and is intended solely for information sharing and research discussion. It does not constitute investment advice, a securities recommendation, a trading instruction, or any guarantee of returns. The company operations, valuations, market prices, and consensus expectations discussed herein may change over time. Readers should independently verify the data and make their own decisions.
1. Core Conclusion
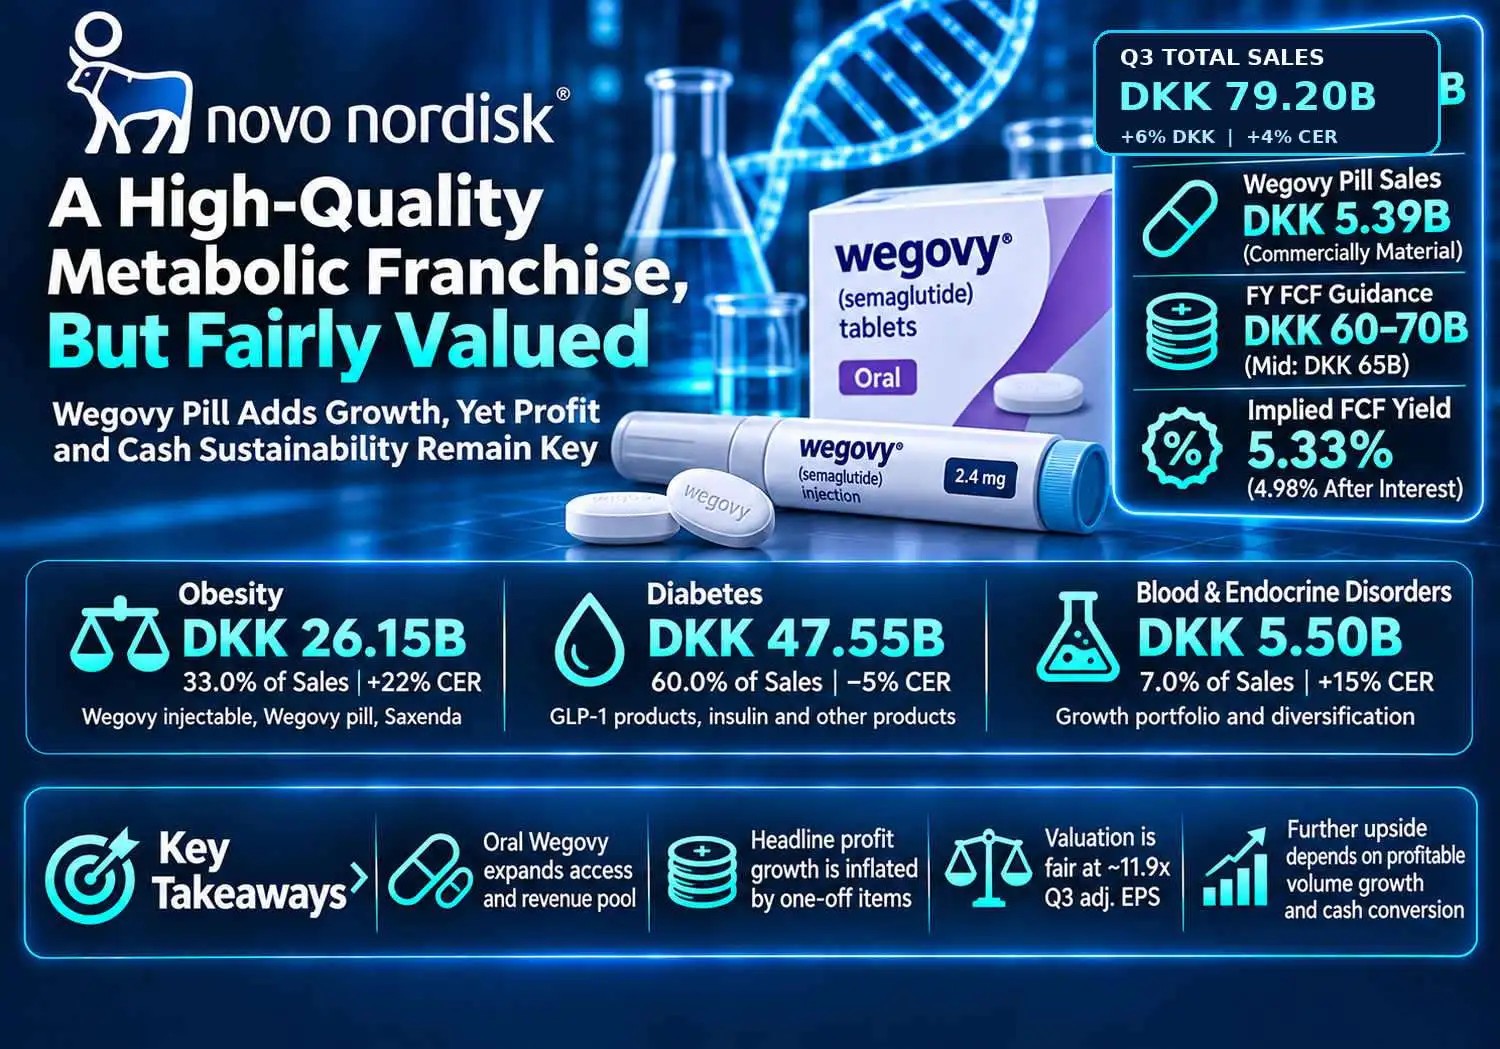
Overall judgment: Novo Nordisk A/S remains a high-quality metabolic-disease franchise, but the equity is approximately fairly valued rather than clearly cheap. Our risk-reward assessment is mildly negative at the November 9 NYSE close of USD 41.38. The decisive variable is whether combined oral and injectable sales can grow fast enough to offset lower net prices while preserving cash after investment and interest.
-
The pill is commercially material; the broader recovery is incomplete. Q3 Wegovy pill sales reached DKK 5.394 billion, while total obesity sales grew 22% at CER and diabetes sales fell 5%. The new formulation expands the revenue pool, but investors should value the combined franchise rather than extrapolate a launch curve in isolation.
-
The headline profit acceleration overstates the underlying improvement. Adjusted EBIT grew 27% at CER, but the comparison includes approximately DKK 9 billion of transformation expenses in Q3 2025. Current adjusted EBIT also retains around DKK 3.5 billion of one-time expenses. These asymmetries make the published growth rate a poor standalone measure of sustainable earnings momentum.
-
The cash yield supports the valuation, but offers limited protection against execution risk. Using approximately 4.41 billion shares and DKK 6.6785 per USD gives equity value of DKK 1,218.7 billion. The DKK 65 billion midpoint of company FCF guidance implies a 5.33% yield; subtracting an illustrative DKK 4.3 billion of annual cash interest (a rounded annualisation of nine-month interest paid) lowers it to 4.98%. That is reasonable compensation for a durable franchise, with limited room for another pricing reset.
-
A low earnings multiple is partly an accounting and timing question. Annualising Q3 adjusted EPS of DKK 5.79 gives about 11.9x earnings, compared with 18.2x annualised reported EPS. Neither is a forward consensus multiple. Our cash sensitivity gives roughly USD 37.5 per ADR at DKK 60.7 billion of after-interest cash and a 5.5% required yield, versus USD 28.3 in a stressed case and USD 50.9 in a recovery case. These are analytical scenarios, not price targets.
-
The guidance upgrade is encouraging, but the next cash bridge matters more. Full-year adjusted sales and EBIT growth guidance moved from -6%–0% to -2%–+2% at CER, while FCF guidance increased from DKK 45–55 billion to DKK 60–70 billion. Nine-month FCF already totals DKK 83.780 billion, implying a Q4 outflow of DKK 13.780–23.780 billion. That arithmetic argues against annualising the nine-month cash result.
Valuation method: USD 41.38 × 4.41 billion shares × DKK 6.6785 per USD. The share count is rounded secondary-provider data; the FX input is the November 9 reference-rate observation reproduced by evaluta.dk and cross-checked with Ohmyfin, rather than a synchronised NYSE closing FX quote. We calculate market value directly because the provider's displayed market capitalisation does not reconcile precisely with its price and rounded shares. A 1% change in FX or shares changes the calculated cash yield by approximately 1% in relative terms.
The investment disagreement is specific: a large obesity market does not automatically translate into a return to the company's earlier growth trajectory. At the current valuation, Novo needs evidence that oral access creates additional profitable treatment months. Simply moving existing patients between formulations can improve convenience without delivering the same incremental shareholder value.
2. Company Overview, Business Mix, and Core Operating Metrics
Novo Nordisk A/S is a Denmark-based pharmaceutical company with B shares on Nasdaq Copenhagen and ADRs on the NYSE under NVO. Each ADR represents one B share. The company earns revenue by developing, manufacturing and selling prescription medicines through healthcare distribution channels. Net revenue reflects discounts, rebates, returns and coverage arrangements; a published list price is therefore different from the amount the company ultimately collects.
The business has two reported operating segments: Obesity and Diabetes, and Blood & endocrine disorders. Within the first segment, obesity is the main growth engine, diabetes supplies the largest existing revenue base, and insulin provides a mature cash-generating portfolio. The second segment diversifies the company through treatments for blood and endocrine conditions, but is too small to offset major weakness across the metabolic franchise.
|
Business / Q3 2026
|
Revenue, DKK million
|
Role and economics
|
|
Obesity: Wegovy injectable, Wegovy pill, Saxenda
|
26,146
|
33.0% of group sales; 22% CER growth; launch access and persistence drive incremental value.
|
|
Diabetes: GLP-1 products, insulin and other products
|
47,545
|
60.0% of group sales; 5% CER decline; pricing and competition weigh on a large installed base.
|
|
Blood & endocrine disorders
|
5,504
|
7.0% of group sales; 15% CER growth; a smaller diversification engine.
|
|
Reported segment earnings
|
21,574 / 1,437
|
Obesity and Diabetes / Blood & endocrine disorders EBIT respectively; together they reconcile to reported group EBIT.
|
The segment EBIT amounts sum to DKK 23.011 billion. Obesity and diabetes therapy rows above divide the larger segment, rather than representing separately disclosed profit centres. The segment earnings row includes reported impairment effects; it should not be combined with adjusted group margin as though both used the same accounting basis.
Core operating metrics and changes
|
Indicator
|
Latest verified reading
|
Interpretation
|
|
Q3 group sales
|
DKK 79.195 billion; +6% DKK / +4% CER
|
Reported and adjusted sales are equal in Q3; currency contributes to the difference in growth rates.
|
|
Wegovy portfolio
|
Injectable DKK 20.407 billion; pill DKK 5.394 billion
|
US injectable sales fell 13% at CER, while combined US Wegovy sales grew 21%.
|
|
Ozempic / Ozempic pill or Rybelsus
|
DKK 29.706 billion / DKK 4.938 billion
|
CER growth of -5% / -10%; the diabetes drag has not disappeared.
|
|
Q3 reported / adjusted EBIT margin
|
29.1% / 40.1%
|
DKK 8.709 billion of impairments bridge the EBIT measures.
|
|
9M cash generation and investment
|
CFO DKK 120.993 billion; PP&E DKK 37.213 billion
|
FCF DKK 83.780 billion under the 2026 definition; cash interest is outside CFO.
|
|
September 30 balance sheet
|
Cash DKK 44.151 billion; net debt DKK 79.725 billion
|
Net debt excludes leases and deducts marketable securities.
|
|
November 4 guidance and next event
|
FCF DKK 60–70 billion; FY results February 3, 2027
|
January 1, 2027 list-price changes create an intervening cash and pricing test.
|
Wegovy pill contributes 6.8% of total Q3 revenue and 20.6% of obesity revenue, calculated from the disclosed product totals. Its importance is already large enough to affect group growth. The useful commercial measure is net incremental revenue after any loss from injectable switching, lower net prices and different channel economics. This report does not assume that every pill prescription represents a new patient.
International growth also deserves a separate lens. A new launch can initially reflect wholesaler inventory as well as patient demand. The company identifies a positive Q1 US pipeline-fill contribution in nine-month pill sales. That does not establish an identical Q3 effect, but it explains why shipments alone cannot prove recurring consumption. Repeat fills, treatment duration and reimbursement access would be stronger evidence of durable demand.
No reliable, consistently defined pre-release consensus series was established for this report. We therefore evaluate the release against prior company guidance and the underlying product mix, without labelling the quarter a quantified consensus beat. This avoids mixing ADR EPS, DKK EPS, reported earnings and adjusted earnings into an artificial surprise calculation.
3. Fundamental Quality
|
Metric, DKK million unless stated
|
Q3 2025
|
Q3 2026
|
9M 2025
|
9M 2026
|
|
Reported sales
|
74,976
|
79,195
|
229,920
|
254,506
|
|
Adjusted sales
|
74,976
|
79,195
|
227,271
|
227,746
|
|
Reported EBIT
|
23,682
|
23,011
|
95,922
|
109,690
|
|
Adjusted EBIT
|
23,682
|
31,720
|
93,273
|
97,967
|
|
Reported net profit
|
20,006
|
16,740
|
75,543
|
86,286
|
|
Reported diluted EPS, DKK
|
4.50
|
3.79
|
16.99
|
19.45
|
|
Operating cash flow, restated
|
46,266
|
41,710
|
112,770
|
120,993
|
|
PP&E purchases
|
13,628
|
13,227
|
41,711
|
37,213
|
|
FCF, 2026 definition
|
32,638
|
28,483
|
71,059
|
83,780
|
|
Cash interest paid, 9M only
|
Not shown
|
Not shown
|
2,249
|
3,253
|
|
Cash, period-end balance comparison
|
Dec 2025
|
26,464
|
Sep 2026
|
44,151
|
|
Net debt excluding leases, balance comparison
|
Dec 2025
|
95,424
|
Sep 2026
|
79,725
|
Quarterly and nine-month flows are compared with matching periods. The last two rows explicitly show December 2025 versus September 2026 balances rather than implying that balances belong to the flow-period columns. Annual context is also useful: FY2025 reported revenue was DKK 309.064 billion, EBIT DKK 127.658 billion and net profit DKK 102.434 billion. Those full-year figures are historical anchors, not directly comparable quarter-sized observations.
Growth quality is mixed. Nine-month reported revenue growth includes a DKK 26.760 billion 340B rebate-provision reversal, whereas adjusted revenue is nearly flat in DKK. Treating the reported increase as recurring commercial growth would exaggerate momentum. A reversal releases an existing accounting constraint; it is different from selling an equivalent amount of additional medicine at sustainable net prices.
Margins remain structurally strong, but comparisons need repair. The Q3 reported-to-adjusted EBIT reconciliation is 23.011 + 8.709 = DKK 31.720 billion. Adding the approximately DKK 3.5 billion of retained one-time costs produces an illustrative DKK 35.220 billion, while adding approximately DKK 9 billion of transformation costs to the prior-year base gives DKK 32.682 billion. That simplified DKK comparison implies roughly 7.8% growth, rather than 34% reported-currency adjusted EBIT growth. It is an analyst sensitivity, not an alternative company metric, and does not reproduce the company's CER calculation or resolve every cost classification.
Cash conversion is strong year to date but uneven. Nine-month CFO minus PP&E purchases equals 120.993 - 37.213 = DKK 83.780 billion. Under the 2026 presentation, cash interest paid is classified in financing and interest received in investing. Subtracting DKK 3.253 billion of cash interest yields DKK 80.527 billion before intangible purchases, acquisitions and lease repayments. Accordingly, company FCF is not identical to cash freely distributable to equity holders after every economic outlay.
The full-year cash guide implies Q4 FCF of 60–70 minus 83.780, or negative DKK 23.780–13.780 billion. We retain that implication even though it looks sharply different from Q3. It may reflect payment timing and working capital; it should not be replaced with an invented smoother cash forecast. A detailed management bridge would determine whether this is conservative guidance, delayed rebates and tax, or an additional conversion issue.
The balance sheet is sound; allocation discipline still matters. Net debt excluding leases fell from DKK 95.424 billion at year-end to DKK 79.725 billion. Nine-month dividends and buybacks total DKK 61.898 billion. Company FCF covers that amount, but the coverage is thinner after interest and other investment. Pipeline impairments also demonstrate that purchased or developed optionality can lose value despite strong current product margins.
Reproducible operating-to-value transmission
Consider a purely illustrative 2027 sensitivity based on Q3 annualised obesity revenue: DKK 26.146 billion × 4 = DKK 104.584 billion. Assume treatment volumes rise 20%, net revenue per equivalent treatment falls 10%, and mix is unchanged. Revenue then increases 1.20 × 0.90 - 1 = 8%, or DKK 8.367 billion. This is a scenario, not company volume or pricing guidance.
At an assumed 45% incremental operating margin and 22% tax rate, the additional after-tax operating profit is 8.367 × 45% × 78% = DKK 2.937 billion. Assuming 80% cash conversion after incremental investment and working capital gives DKK 2.349 billion of additional annual equity cash. At a 5.5% required cash yield, that stream is worth approximately DKK 42.7 billion, or USD 1.45 per ADR using 4.41 billion shares and the stated FX rate.
If net revenue per treatment instead falls 20%, the same 20% volume expansion gives 1.20 × 0.80 - 1 = -4%. Applying the same mechanical assumptions produces approximately DKK 1.175 billion less annual cash and USD 0.73 less value per ADR. The threshold is concrete: a 10% net-price decline requires more than 11.1% volume growth merely to keep revenue flat. List-price reductions must not be substituted directly for these assumed net-price changes.
Our central cash sensitivity uses DKK 60.7 billion after interest and a 5.5% required yield, giving approximately USD 37.5. Stress uses DKK 50 billion and 6%, giving USD 28.3; recovery uses DKK 75 billion and 5%, giving USD 50.9. These discretionary cash and yield assumptions are not forecasts or probabilities. The range shows why successful patient expansion can coexist with a fairly valued stock. The single most important variable is sustainable net revenue per treated patient relative to the cost of acquiring and retaining that patient.
4. Industry and Competitive Landscape
The relevant market is branded metabolic treatment, particularly GLP-1-based diabetes and obesity therapies. The value chain includes discovery, clinical trials, active-ingredient manufacturing, formulation, distribution and payer access. Manufacturing reliability and clinical outcomes determine whether a medicine can compete; reimbursement and net pricing determine whether demand becomes attractive cash flow.
|
Competitive layer
|
Verified position / metric
|
Valuation consequence
|
|
Obesity growth engine
|
Novo obesity Q3 revenue +22% CER; diabetes -5% CER
|
Company growth is narrower than the obesity-market narrative.
|
|
Current commercial benchmark
|
Lilly Mounjaro USD 10.723 billion; Zepbound USD 5.352 billion in Q3
|
Lilly captures substantial demand; its scale is not a like-for-like obesity market-share measure.
|
|
Convenience and access
|
Wegovy pill DKK 5.394 billion Q3 revenue
|
Oral adoption can expand reach, but switching and price mix determine incremental economics.
|
|
Future dosing competition
|
Amgen MariTide Phase 3 programme
|
Potential convenience competition; trial participation is not approval or commercial revenue.
|
|
Diversified treatment alternatives
|
Pfizer Q3 revenue USD 16.583 billion; portfolio competitor
|
Useful capital-allocation benchmark, not a current scaled GLP-1 substitute.
|
|
Company / period
|
Revenue / growth
|
Profit or investment / operating marker
|
Competitive reading
|
|
Novo Nordisk A/S / Q3 2026
|
DKK 79.195 billion; +4% CER
|
Adjusted EBIT margin 40.1%; PP&E DKK 13.227 billion
|
Oral recovery offsets part of established-product pressure.
|
|
Eli Lilly and Company / Q3 2026
|
USD 24.397 billion; +39% reported
|
GAAP gross margin 83.9%; R&D approximately USD 4.2 billion
|
Current commercial growth winner; volume rises faster than pricing declines.
|
|
Amgen Inc. / Q3 2026
|
USD 10.365 billion; approximately +8% reported
|
FCF approximately USD 3.7 billion; MariTide Phase 3 ongoing
|
Future obesity challenger funded by a diversified cash engine.
|
|
Pfizer Inc. / Q3 2026
|
USD 16.583 billion; approximately flat reported
|
Adjusted diluted EPS USD 0.87; FY revenue guide USD 62–64 billion
|
Diversified pharmaceutical and pipeline competitor; limited direct current GLP-1 comparability.
|
These are company-wide metrics for the same calendar quarter, with different currencies and accounting definitions. Gross margin, adjusted EBIT margin, FCF and EPS are distinct measures; the table does not rank profitability by comparing them directly. Pfizer is a broad pharmaceutical capital and pipeline competitor, while Lilly is the closest scaled commercial comparator and Amgen is a prospective obesity competitor. No precise market-share estimate is inferred from total corporate revenue.
Lilly is winning current incremental commercial growth. Novo's injectable diabetes and US injectable obesity products are losing momentum. Novo is nevertheless a net beneficiary of expanding obesity treatment demand because its oral product and international portfolio still add revenue. That net benefit is weaker than a claim of restored competitive leadership. Amgen represents future pressure on dosing convenience; Pfizer provides an example of the challenge of translating a diversified pipeline into renewed group growth.
A convenience advantage has to survive the reimbursement gate. A product can win patient interest while delivering lower revenue per treatment if self-pay channels carry different discounts or public and private coverage terms tighten. Conversely, affordable access can expand the treated population enough to increase profit even when headline prices decline. Our base judgment favours continued demand expansion, with a restrained multiple until combined-product revenue and after-interest cash improve together.
5. Key Risks
-
Net-price erosion exceeds volume gains. If net price falls 10% and treatment volume grows less than 11.1%, revenue contracts before mix effects. Lower gross profit then pressures cash and the valuation supported by the current yield.
-
Pill adoption cannibalises higher-value treatments. If new oral shipments primarily replace existing injectable patients or include temporary channel inventory, launch growth overstates incremental patient economics and future earnings require revision.
-
Cash-payment timing proves less favourable. If Q4 outflows exceed the DKK 23.780 billion implied lower end, full-year FCF falls below guidance and weakens confidence in working-capital conversion.
-
The 2027 price transition disrupts cash collection. The company has announced relevant US list-price reductions effective January 1. Net-price effects depend on rebates and access arrangements; rebate settlement timing can pressure cash even when volume grows.
-
Pipeline or manufacturing investment loses value. Further trial failures, delays or underused capacity could require additional impairments and replacement R&D spending, reducing the value of future product options and cash available for distributions.
-
Competition changes clinical or convenience standards. Stronger rival efficacy, coverage or dosing propositions could force higher commercial spending, lower net prices or slower patient acquisition.
-
FX and accounting presentation obscure the trend. A weaker USD can lower translated revenue and earnings despite local demand growth. Changing non-IFRS adjustments or overlooking financing-classified interest can lead investors to overstate sustainable cash returns.
6. Monitoring Checklist
-
Combined obesity revenue: sustain at least 20% CER growth without a worsening diabetes decline. This would strengthen the recovery thesis; pill sales alone are insufficient.
-
US injectable stabilisation: improve the Q3 -13% CER Wegovy injectable trend toward zero while combined US Wegovy growth stays above 15%. This would reduce concerns about weak incremental oral economics.
-
Cash close for 2026: achieve company FCF of at least DKK 60 billion and publish an understandable bridge for Q4 outflows. Cash below that threshold weakens valuation support.
-
Adjusted margin quality: keep adjusted EBIT margin near 40% or better as the prior-year transformation comparison disappears. A drop below 35% without a temporary, documented driver would challenge the earnings base.
-
Capital and financing: hold PP&E expenditure around the DKK 50 billion guide and continue net-debt reduction from DKK 79.725 billion. Lower capex only strengthens the thesis if supply reliability is preserved.
-
January 1, 2027 pricing transition: track realised net revenue and rebate cash payments, rather than equating the announced USD 675 list price with net collections. Stable combined revenue after the transition would be constructive.
-
February 3, 2027 annual results: focus on the 2027 sales and cash outlook, recurring demand after launches, and pipeline execution. After-interest annual cash sustainably above DKK 67 billion would meet an approximately 5.5% yield hurdle at the current calculated equity value.
7. Sources
All sources were checked on November 10, 2026. Financial facts relate to periods ended September 30 unless specified. Company-issued reports and SEC filings are primary sources; stock prices, share counts and FX reproductions are secondary sources. The November 4 release and financial report provide the adjustment definitions, guidance comparison, product tables, cash classification and financial calendar. The presentation supplements operating and pipeline context. Historical annual accounts provide FY2025 context and ADR structure.
LBank universe verification preceded selection: NVOON/USDT, COSTON/USDT and AAPLON/USDT official spot interfaces were opened, with populated quote/turnover data, chart controls and buy/sell inputs. Official listing notices establish the underlying-company mappings. NVO has no coverage entry within the preceding 90 days; COST and AAPL were excluded by the repeat-coverage rule. Cached interface quotes are not used as NYSE prices. NVOON is an Ondo tokenised product, distinct from directly owning the NYSE ADR; this report's financial valuation concerns the underlying company.
Material boundaries: no verified pre-release institutional consensus or detailed independent patient-level retention data; no complete management bridge from nine-month FCF to the full-year guide. Sensitivities are explicitly analyst assumptions. None of these gaps is filled with an invented estimate.
-
-
-
-
Investor presentation Q3 2026 (https://www.novonordisk.com/content/dam/nncorp/global/en/investors/pdfs/financial-results/2026/Q3-2026-full-presentation.pdf)
-
-
-
-
-
-
-
-
-
-
-
-
-
-
-



 Transfer